
Price Analytics
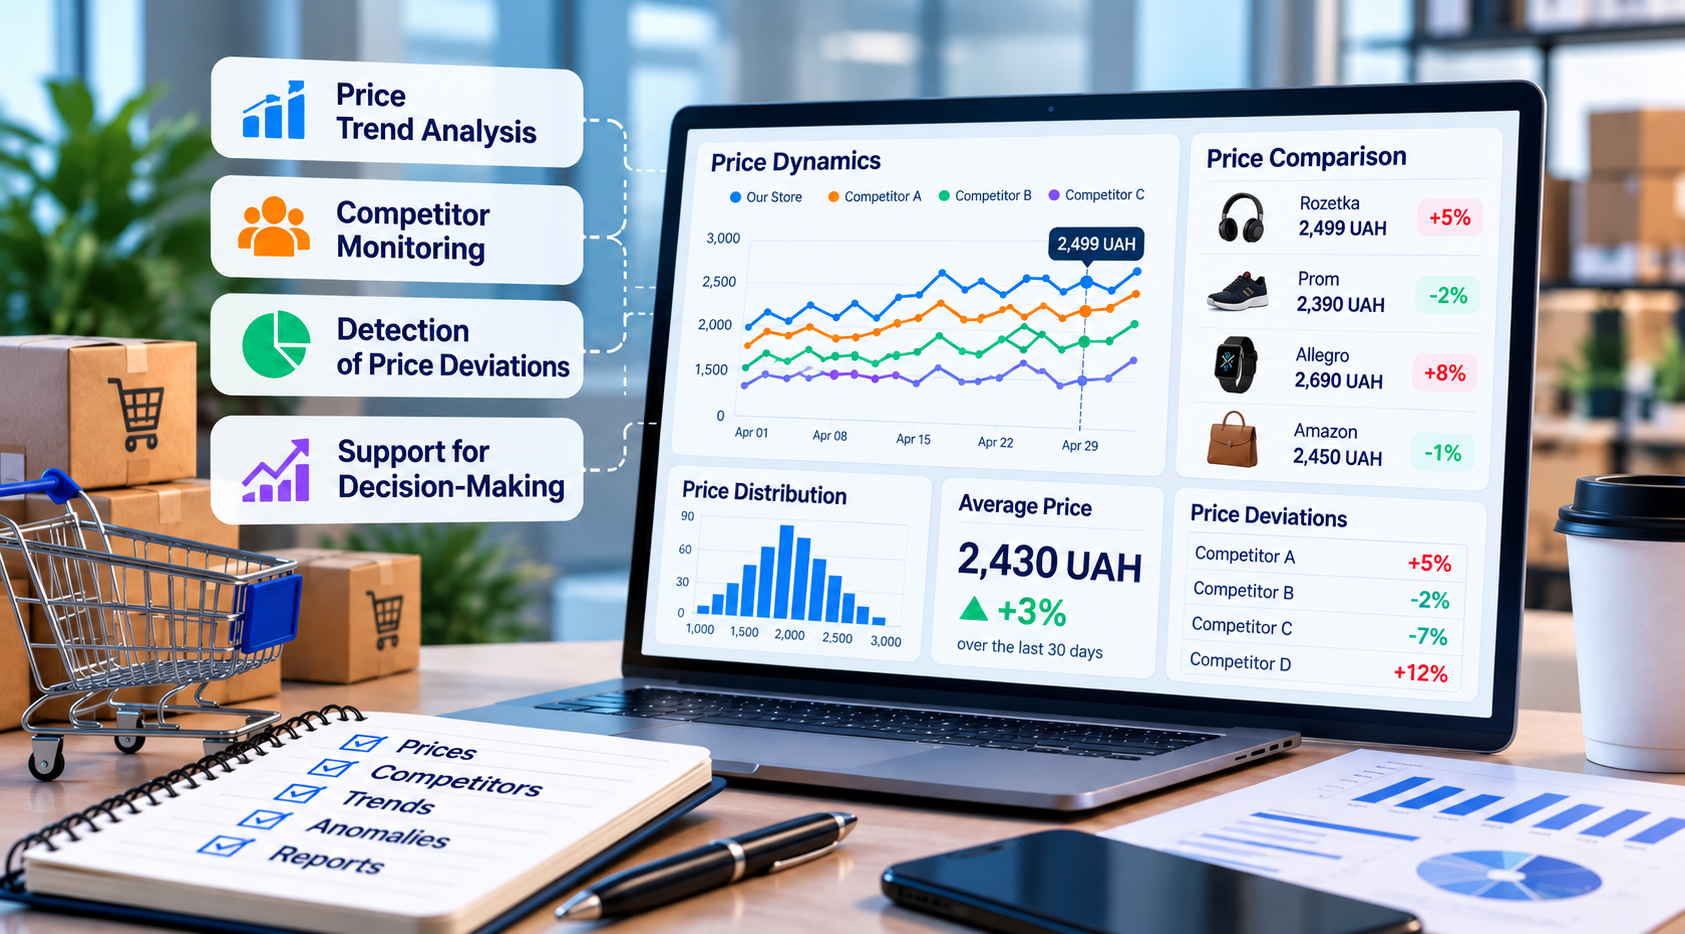
Price analytics is the systematic analysis of pricing data, price trends, the competitive landscape, and seller behavior. It helps transform large volumes of collected data into meaningful metrics, identify market trends, and use reliable data to make informed pricing and e-commerce decisions.
Why Businesses Need Price Analytics
Individual price points only reflect the situation at a specific moment, while price analytics makes it possible to track changes and identify patterns over time. It helps businesses assess their position relative to competitors, detect significant price deviations, analyze seller behavior, and understand how the market is evolving. This provides a solid foundation for more informed business decisions.
What Data Is Used for Price Analytics
Price analytics uses current and historical prices, promotional offers, seller information, product availability, product assortments, and timestamps of recorded price changes. Manufacturers and brands may also analyze recommended retail prices (RRP) and minimum advertised prices (MAP), the extent of deviations from these pricing benchmarks, and the number of sellers whose prices fall outside the established guidelines. Combining these metrics provides a more comprehensive picture of the market.
Price Trend Analysis
Price trend analysis shows how sellers’ offers have changed over a specific period. It helps businesses track the frequency and magnitude of price changes, identify periods of significant price decreases or increases, and compare the behavior of different market participants. Historical data makes it possible to distinguish a one-time price deviation from a sustained trend.
Competitor Price Comparison
Detecting Price Deviations
Price analytics helps automatically detect prices that differ significantly from established benchmarks or the overall market level. For manufacturers and brands, these benchmarks may include recommended retail prices (RRP) or minimum advertised prices (MAP), while online retailers may use average competitor prices or their own pricing rules. Price deviation analysis helps identify where a change occurred, how significant it is, and how long it persists.
Seller Behavior Analysis
Seller behavior analysis helps identify which sellers change their prices most frequently, launch promotions, or are the first to deviate from the overall market price level. Historical data helps reveal recurring patterns of behavior and assess how price changes by one seller influence other market participants. This is particularly important for manufacturers and distributors managing large dealer networks.
Identifying Market Trends
Analyzing historical data helps identify trends that are difficult to detect through one-time checks. These may include gradual price decreases or increases, seasonal fluctuations, changes in the level of competition, or emerging patterns in seller behavior. Understanding these trends helps businesses assess market developments and proactively adjust their strategies.
Data Visualization and Reporting
Large volumes of pricing data are easier to analyze using charts, tables, dashboards, and automated reports. Data visualization helps businesses quickly identify price trends, deviations, changes in sellers’ market positions, and other important metrics. Reports provide regular, structured insights into market conditions, allowing businesses to focus on the most significant changes.
Analytics as a Foundation for Decision-Making
Price analytics delivers practical value when its findings are used to make specific business decisions. Combining current and historical data helps businesses assess market conditions, evaluate the effectiveness of their pricing strategies, and respond promptly to significant changes. Systematic analysis enables businesses to move beyond isolated observations and make data-driven decisions.